


|
StableBit Scanner 2.X
An innovative disk surface scanner, disk health monitor and file recovery system.
|
Disk List
(Build 3096)

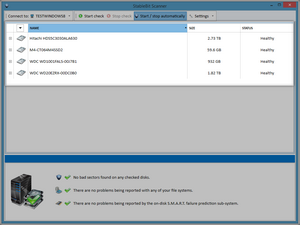
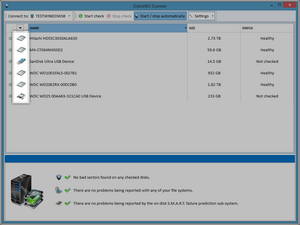
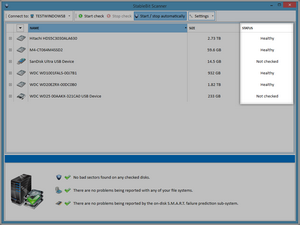
The disk list shows all the disks in the system. The list displays various information about the disks.
-
 This disk is connected internally or in an eSATA type enclosure.
-
 This disk is an external USB hard drive.
-
 This disk is an USB flash drive.
-
 This is a StableBit CloudDrive.
-
Not checked: We have not scanned and are not currently scanning the disk. And the S.M.A.R.T. data indicates the disk is healthy (or we cannot access the S.M.A.R.T. data).
-
Healthy: The scans have completed without issues, and the S.M.A.R.T. data indicates the disk is healthy (or we cannot access the S.M.A.R.T. data).
-
Damaged: The surface scan has found one or more unreadable sectors on the disk, indicating a problem with the drive.
-
Scanning ##.##%: This indicates that there is an active surface scan being performed on the disk.
-
Scanning file system...: This indicates that there is an active file system scan being performed on one or more of the partitions on the disk.
-
Waiting to scan (disk busy): This means that there is activity on the disk, outside of the scans. The scan is halted until the disk is no longer being used, to prevent any performance impact on the system.
-
Waiting to scan (bus saturated): There is disk activity on the same controller, and the scan has been halted until the disk activity has ended, to prevent bottlenecking the controller.
-
Waiting to scan (temperature): This disk it outside of the acceptable temperature range, and the StableBit Scanner is waiting for the disk to cool down before resuming the scan.
-
Waiting to scan (temperature equalization): Several of the disks are running at significantly different temperatures. To prevent localized hot spots in the system, the scan has been halted until the disk temperatures have equalized.
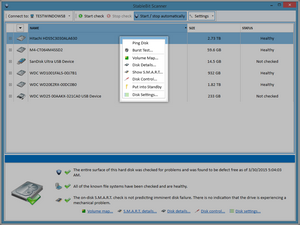
Open the right click menu by right clicking on any disk in the disk list.
-
Ping Disk - This option will periodically ping the disk, causing disk activity to occur periodically. This is useful for identifying disks.
-
Burst Test - This option will open a window that displays the performance information, and allows you to start or stop the burst test. This test is good for stress testing the reliability of the disk connection (the connection, cable and/or controller). It will continue to run the test in the background if you close the window.
-
Disk details... - Click this to open the Disk Details window. This gives some advanced statistics about the disk (such as connection type, feature support, bus type, etc).
-
Show S.M.A.R.T. - Click this to open the S.M.A.R.T. window for this disk. This option is only available when S.M.A.R.T. is accessible on this disk.
-
Disk Control - This exposes some of the advanced hardware parameters (such as acoustic management and power management options).
-
Put into Standby - Forces the disk into standby. This may not work for all disks.
-
Disk Settings - Opens the Disk Settings window, and allows you to specify per disk settings.
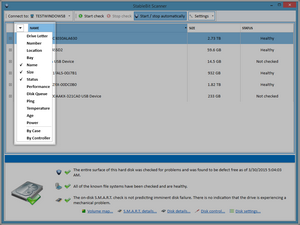
By default, we only expose the "Name", "Size" and "Status" headers, and we sort the disks by the disk names. However, there is a lot more information that can be displayed here.
If you click on the arrow box above the drive icon column, or right click anywhere on the column header, you can enable and disable the different columns.
-
Drive Letter: This displays the drive letters and folder mount points for all the volumes on the disk.
-
Number: This is the disk number of the drive, as listed in Disk Management and other locations.
-
Location: This lists the full case and bay information for the disks.
-
Bay: This displays only the bay for the disks.
-
Name: Displays the full name of the disk (by default, the model number of the drive).
-
Size: This shows the actual size of the disks.
-
Status: This displays the drive letters and folder mount points for all the volumes on the disk.
-
Performance: This displays the activity on the disk, showing you how busy the disk is.
-
Disk Queues: This shows you the queue length for all of the disks. Generally, if this number is higher than the number of platters on the disk, the disk may be overworked.
-
Ping: When the "Ping Test" is enabled, this shows the length of time it takes to ping the disk. If this shows a long time, then it may indicate a performance issue with the disk.
-
Temperature: Shows the disk temperature only if we are able to get the S.M.A.R.T. data from the disk.
-
Age: This shows the approximate age of the disk, as measured by the Power On Hours S.M.A.R.T. data.
-
Power: This displays the power status of the disk. Normally, this is "Active". But if the disk has been put into standby mode, it will show up as "Standby or Active", as we are not able to determine the status without querying the disk which will wake it up.
In addition to these columns, there are two "Sort By" options in the menu. These can be very helpful, if you have a large number of disks, as it can help organize the list of disks in your system.
-
By Case: This groups the disk by the cases, as set in the Disk Settings options for the disks.
-
By Controller: This groups the disks by the controller card that they're attached to, as well as displays the Controller Card being used.